MPC 006 - IGNOU Statistics in Psychology - First Lesson
(Please Note - I have diversified my work on Excelling Psychology into different blogs for better organization of content. I am continually working on the same, so these sites will be updated with more content soon.
IGNOU Psychology learners may be interested in the following:
Model answers for various blocks of sub-communities of courses:
https://psychologymodelanswers.blogspot.com/2019/04/ignou-bpc-001-sample-answer-for.html
Statistics for Psychology in very simple language:
https://statisticsforpsychology.blogspot.com/)
IGNOU notes provide answers of perfect length and content for examination questions. But how much information can you remember without understanding any of it?
In this series, I provide a series of simplified explanations to supplement the Statistics component of MAPC.
This guide is for the introductory unit - Block 1 Unit 1.
------------------------------------------------------------------------------------------------------------------------------------------------------
(*Please click on any image to enlarge it)
Since I use a sample to understand my population, I use statistics to estimate parameters.
------------------------------------------------------------------------------------------------------------------------------------------------------
When samples are large in size i.e when they consist of a large number of cases (people or objects), they represent the population better.
Since most populations are assumed to be normally distributed, representative samples derived from them should also be normally distributed.
The variable of interest should have been measured using the interval scale of measurement.
To understand why an interval scale is needed, we first need to understand what problems would arise if we used any scale lower than the interval scale:
------------------------------------------------------------------------------------------------------------------------------------------------------
Another way of using data collected from a sample, is to perform a different category of tests on
the data - called non-parametric tests. The word 'non-parametric' by itself indicates that the data computed by such tests need not represent the population. What purpose then, do such tests serve? There are two points to be noted here:

(more to be added soon.....)
IGNOU Psychology learners may be interested in the following:
Model answers for various blocks of sub-communities of courses:
https://psychologymodelanswers.blogspot.com/2019/04/ignou-bpc-001-sample-answer-for.html
Statistics for Psychology in very simple language:
https://statisticsforpsychology.blogspot.com/)
IGNOU notes provide answers of perfect length and content for examination questions. But how much information can you remember without understanding any of it?
In this series, I provide a series of simplified explanations to supplement the Statistics component of MAPC.
This guide is for the introductory unit - Block 1 Unit 1.
------------------------------------------------------------------------------------------------------------------------------------------------------
(*Please click on any image to enlarge it)
Parameters
A population is the target of interest of a study. If I want to know how many people in Mumbai suffer from depression, my population is Mumbai.
Now,
I obviously cannot study the whole of Mumbai to know how many people
suffer from depression. Since the population is so large, I study
only a few people of the population. This section of the population
that I study, is a sample.
 |
| Sample is the section of Population that we study |
The data of a population is a parameter. The depression rate in my population is a parameter.
In the same way, data of a sample is a statistic. The depression rate in my sample is a statistic.
 |
| Statistics help us estimate Parameters |
Since I use a sample to understand my population, I use statistics to estimate parameters.
------------------------------------------------------------------------------------------------------------------------------------------------------
Parametric Tests
One way of using data collected from a sample, is to perform tests on the data - called parametric tests. The word 'parametric' comes from the concept of 'parameters' discussed in the previous section. Parametric tests have been so developed that they have to be used with samples that represent the population.
In order to represent the population, a sample must have the following characteristics:
In order to represent the population, a sample must have the following characteristics:
1) It should be large in size
When samples are large in size i.e when they consist of a large number of cases (people or objects), they represent the population better.
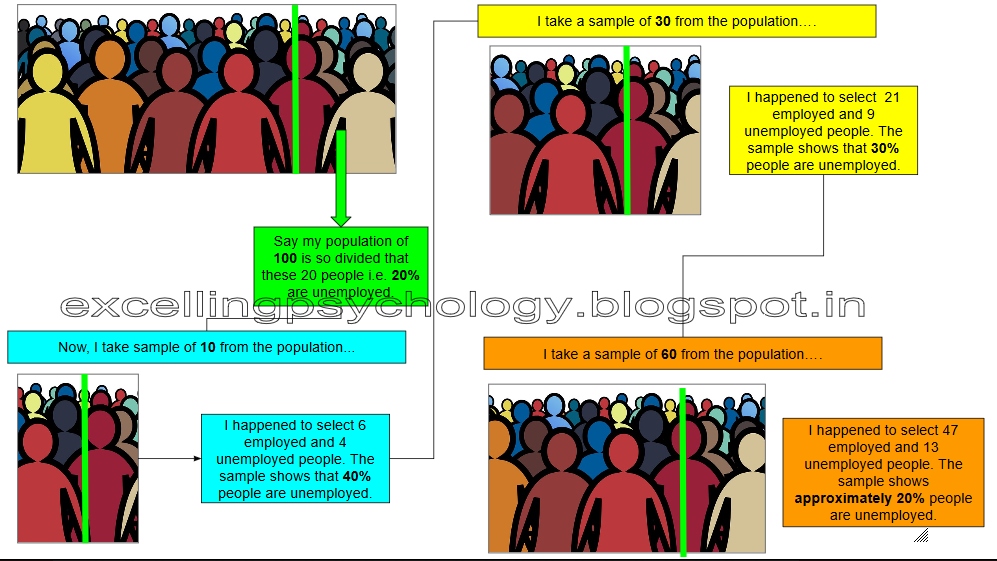
- Consider this - you want to estimate what percentage of adult men in Mumbai are unemployed. You survey 100 men of Mumbai out of which you find that 20 are unemployed. You conclude that 20% of adult men in Mumbai are unemployed.
Your friend, trying to make the same estimate, approaches 10,000 men of Mumbai and finds that 1000 are unemployed. She concludes that 10% of adult men in Mumbai are unemployed.
Who has the more accurate estimate, judging by sample size alone?
 |
| As a sample become larger, it is natural that the bigger section in the population contributes to it more greatly than the smaller section of the population. |
---
2) It should be normally distributed
Since most populations are assumed to be normally distributed, representative samples derived from them should also be normally distributed.
(A variable is anything - trait, object, belief, etc. - that can take on multiple values. For example, stress is a variable. At any given time, you could be stress-free, mildly stressed, severely stressed, etc.)
- It is found that most variables are distributed in a particular pattern among people - that is, most people possess an average value of the variable, while very few people possess very large values of the variable.
- For example, friendliness is assumed to be normally distributed - most people are average as regards friendliness, while few are over-friendly and few are hostile. This pattern of a variable is referred to as a 'normal distribution.'
- In other words, when something is normally distributed, it is spread such that most people will be 'average' with regards to it, some will be 'above average,' some 'below average,' and a very few will be 'highly above average,' or 'highly below average.'
 |
| A normal distribution has a very specific spread of scores |
- When a sample is not normally distributed, it has included a lot of cases from one section of the population. Then it has definitely not represented the entire population.
- Larger samples are found to be normally distributed since they include many cases of the population. Smaller samples are usually not normally distributed.
 |
| The distribution of a representative sample naturally matches the distribution of its population |
---
3) It's variables should have been measured on the interval scale of measurement
The variable of interest should have been measured using the interval scale of measurement.
To understand why an interval scale is needed, we first need to understand what problems would arise if we used any scale lower than the interval scale:
- Suppose I am interested in studying job satisfaction among the working women in Mumbai, and have selected a sample of the same. One option I have is to rank them in order of most to least satisfied. Some aspects of measuring job satisfaction in this manner must be considered:
- Someone who is the second most satisfied in my sample may be just a little less satisfied than the first most satisfied person. However, someone who is third most satisfied may be very less satisfied compared to the second most satisfied. In other words, the difference between one pair of ranks would not be equal to the distance of another pair.


- Also, ranking becomes exclusive to a sample. Is the most satisfied person of my sample also the most satisfied in the population? Most likely not. How less is his satisfaction compared to the most satisfied person in the population? This cannot be determined because we have no absolute value of his satisfaction, we only have a value relative to other cases in a particular sample.
- Suppose I select 50 people from a population of 500 in my sample. By chance, they all happen to be from the lower end of the distribution i.e. all from the least satisfied section of the population. Now, the most satisfied among these least satisfied, has a very different standing in comparison to the population. In other words, the sample is very different from the population and certainly not representative.

- A better way for me is to assign some definite value of satisfaction to every case in the sample. Say, I rate all the cases on a scale of 1 to 10 on how satisfied they are with their job. Further, I construct this scale in a way that the person who scores 4 on the scale is as much more satisfied than a person who scores 3 on the scale; as a person who scores 7 on the scale is more satisfied than a person who scores 6 on the scale. Such a scale is called an interval scale of measurement. The advantage of this scale is that the differences between intervals or distances on the scale are equal.
 |
| On an interval scale of measurement, the distances between any two consecutive points are equal. |
- When distances are equal, they are meaningful and not random as they are in the case of ordinal scales. Meaningful distances can be added, subtracted and therefore, averaged. Averages are very necessary when we need to perform parametric tests.
- Ranks obtained from ordinal scales represent unequal distances. Scores represent equal distances. Scores, as we know, can be used for further mathematical operations.
 |
| An ordinal scale gives us ranks, an interval scale gives us scores. |
- Furthermore, I can easily determine who is the most satisfied person in my sample, if I need this information. Say no one has scored more than 8 in my sample. So, the person with a score of 8 is the most satisfied person.
 |
| Ranks do not represent how a variable is distributed in the population, but scores do. |
Simply
put, interval scales give us scores, and scores represent the distribution of a variable in a population.
When we discussed the normal distribution in point (2) above, we saw that the key factor in determining how a variable is distributed in a population is:
---
4) It should show Homoscedasticity
When we discussed the normal distribution in point (2) above, we saw that the key factor in determining how a variable is distributed in a population is:
- The variance - We saw that the scores that are different from the mean follow a very fixed pattern. That is, most of the scores are similar to the average value, some are a little more different from the average value, while a very few are extremely different from the average value. This spread or distribution of scores is called the variance.
Variance is the factor that we use to determine whether the sample represents the population. If the sample has the same distribution pattern as the population, then it represents the population. If this variance changes, then parametric tests cannot be used for a given sample.
Let's understand homoscedasticity now. It is also referred to as homogeinity of variance or equality of variance, etc. For our purposes, it is best to understand it as constant variance. We will understand it very easily once we break it down to its two constituent terms:
The assumption of constant variance is particularly important when a group is exposed to treatment (a remedy or intervention) of any kind.
Let's understand homoscedasticity now. It is also referred to as homogeinity of variance or equality of variance, etc. For our purposes, it is best to understand it as constant variance. We will understand it very easily once we break it down to its two constituent terms:
- Constant - A constant, as we know, is a fixed mathematical value.
- Variance - As we defined, variance refers to the spread of scores in a distribution.
 |
| Constant variance implies an absence of fluctuation in the spread of scores |
The assumption of constant variance is particularly important when a group is exposed to treatment (a remedy or intervention) of any kind.
- Suppose I study the concentration span of a sample that meets the requirement of homoscedasticity for a parametric analysis. In other words, this sample shows constant variance.
- Now, I expose the group to a treatment - I make them undergo a one-week therapy that helps them increase their concentration span.
- When I test them again, I expect that the treatment would have benefited each member of the sample increase their concentration span in exactly the same way i.e. I expect that it would have added a constant to the concentration span of each person.
- For example, suppose my program was designed to increase the concentration span of people by 5 minutes. I would expect that someone who earlier had a concentration span of 10 minutes, would now have a concentration span of 5 minutes. Likewise, someone who had a concentration span of 30 minutes would now have a concentration span of 35 minutes and so on.
- When represented as a group distribution, this would mean that the overall pattern of frequencies would take a shift, but individual composition of frequencies would remain constant. This is explained in the following diagram:
 |
| The homoscedasticity of a sample must be maintained after treatment in order to use parametric tests of comparison |
- The opposite case would be that the individual composition of frequencies would change. This is explained in the following diagram:
 |
| If heteroscedastic variance is seen a distribution post treatment, then parametric tests for comparison cannot be used |
---
5) It should show Independence of Observations
The values observed by measurement of a sample should not be dependent on each other in any manner - the measurement of one participant should not be influenced in any way by the measurement of other participants. The sample must be selected in a fair manner, free from bias.
Dependence can take place in many different ways. A few of them are as follows:
- For example, observations may be mutually dependent on each other based on the time of observation.
- This would be the case when researchers are surveying the cases of depression in a sample during the winter season. Since there would be many cases of seasonal depression in the sample, it would not match the regular distribution of depression in the population.
- Another example is of relationships between participants in a sample which may make the values of their variables dependent on each other.
- This would be the case when siblings are included in the sample while measuring disorders such as schizophrenia, which are largely inherited. The sample would differ from the population by this virtue because the population consists of many diverse related and unrelated cases.
- Yet another example is if the entire sample belongs to a specific place, the observations will be dependent by this virtue.
- This would be the case if the stress levels of students of a single school are measured and are expected to represent the stress levels of students of an entire city.
 |
| If a sample is dependent on some condition, it will fail to represent the population |
------------------------------------------------------------------------------------------------------------------------------------------------------
Non-Parametric Tests
- First, we do not want to always draw conclusions about the population from a given sample. Sometimes, we just want to understand the sample itself. In such cases, non-parametric tests may serve our purpose as well as parametric tests.
- Consider, for example, a class teacher who only wants to know how many students among the 25 in her class need to be referred for remedial education. She can give them a test, which will simply tell her whether the students meet a certain cut-off of academic aptitude or not. Then she just needs the total i.e. frequency of the students who need to go for the remedial program. (Her analysis here, is based on the nominal and not interval scale of measurement, but it serves her purpose well.)
- Second, just because a sample does not represent the population does not mean that its data has absolutely no connection with the population.
- Suppose I find a slight skew in my data, that is more extreme cases depression than I predicted. One possibility is that the underlying population is also skewed. We cannot rule out this critical possibility, since the normal distribution is an ideal representation of the population, but not necessarily the real representation.
- Also, a few extreme cases does not mean that the data is absolutely inaccurate, it may bee accurate only to a certain extent. This is explained further in the following point.
- Third, is important to note that no statistical test can make a 100% accurate prediction with regards to the population. Some statistical tests are simply found to be more accurate than others, that is, they make less errors in their predictions. Parametric tests are more accurate and less prone to error. Non-parametric tests are less accurate and more prone to error. This does not render them useless, just makes them the less preferred choice as compared to parametric tests.
- Also, when data are not normally distributed - which is the chief criteria to use parametric tests - parametric tests are found to be less accurate with their results than non-parametric tests. We can finally say that both tests have their own effectiveness, and they should be used depending on the purpose of the test.

Since the character of non-parametric tests is very different from those of parametric tests, they are used in conditions such as the following:
1) When a Nominal or Ordinal Scale of Measurement has been used to measure sample data
As partly discussed in assumption (3) of parametric statistics above, nominal and ordinal scales of measurement are not amenable to parametric treatment. However, several non-parametric tests are available for use in the case of such data, as we will see in sections that follow.
Data measured on the nominal scale of measurement has simply been classified into two or more categories. It has no true numerical value. Since it does not give me any information on the exact intensity with which a characteristic is possessed by a given case, it severely limits the inferences I can draw about the population. At most, we can estimate how many cases would fall within a given category in the population.
The same is the case with ordinal data. It has also been classified, with the addition of ordering of data. Such data can help me make comparisons in my sample as to who possesses the greatest value of a characteristic, who possesses a little lesser, and so on. Such ordering is exclusive to the sample, and cannot be generalized to the population which has many additional cases besides the ones in the sample. Again, it does not give me data in terms of scores - in terms of how much intensity a person possesses a characteristic with.
In such cases, it is not possible mathematically operate on the data. I cannot add or subtract the data, further being unable to calculate averages. Therefore, the underlying distribution of the population cannot be determined, and we cannot find out whether the population is normally distributed or not, which is the very condition to use parametric test.
 |
| The nominal scale of measurement enables us to make very limited estimates regarding the population |
The same is the case with ordinal data. It has also been classified, with the addition of ordering of data. Such data can help me make comparisons in my sample as to who possesses the greatest value of a characteristic, who possesses a little lesser, and so on. Such ordering is exclusive to the sample, and cannot be generalized to the population which has many additional cases besides the ones in the sample. Again, it does not give me data in terms of scores - in terms of how much intensity a person possesses a characteristic with.
 |
| Ranks do not give us information about the underlying distribution of a population |
In such cases, it is not possible mathematically operate on the data. I cannot add or subtract the data, further being unable to calculate averages. Therefore, the underlying distribution of the population cannot be determined, and we cannot find out whether the population is normally distributed or not, which is the very condition to use parametric test.


Thanks a lot.it is very helpful
ReplyDeletePlease make some more notes on statistics.
Thank you for appreciating my work. Please let me know your name.
Deletevry much interested in more notes
DeleteMam please make notes on more topics from Ma psychology
ReplyDeleteThank you for visiting my blog. Your suggestion is noted.
DeleteThank you very much Ma'am, was completely baffled after leafing through the first unit. Your blog was a Godsend. Looking forward to more. Grateful
ReplyDelete